The meeting is half over and the dashboard is still on the screen. Six tiles, three slicers, a date range across the top. The numbers are correct. The visuals are clean. Nobody is looking at it.
The conversation has moved on to something else - what should we do about the drop in Q3 conversion? Someone says they think it's the new pricing page. Someone else says it's the email cadence. A third person says they'd need to dig into the cohort data, which isn't on the dashboard. The dashboard sits there, doing its job, while the actual decision happens around it.
This is the gap. Not the gap between good and bad dashboards, the gap between dashboards and a different category of artefact entirely.
What a dashboard is for
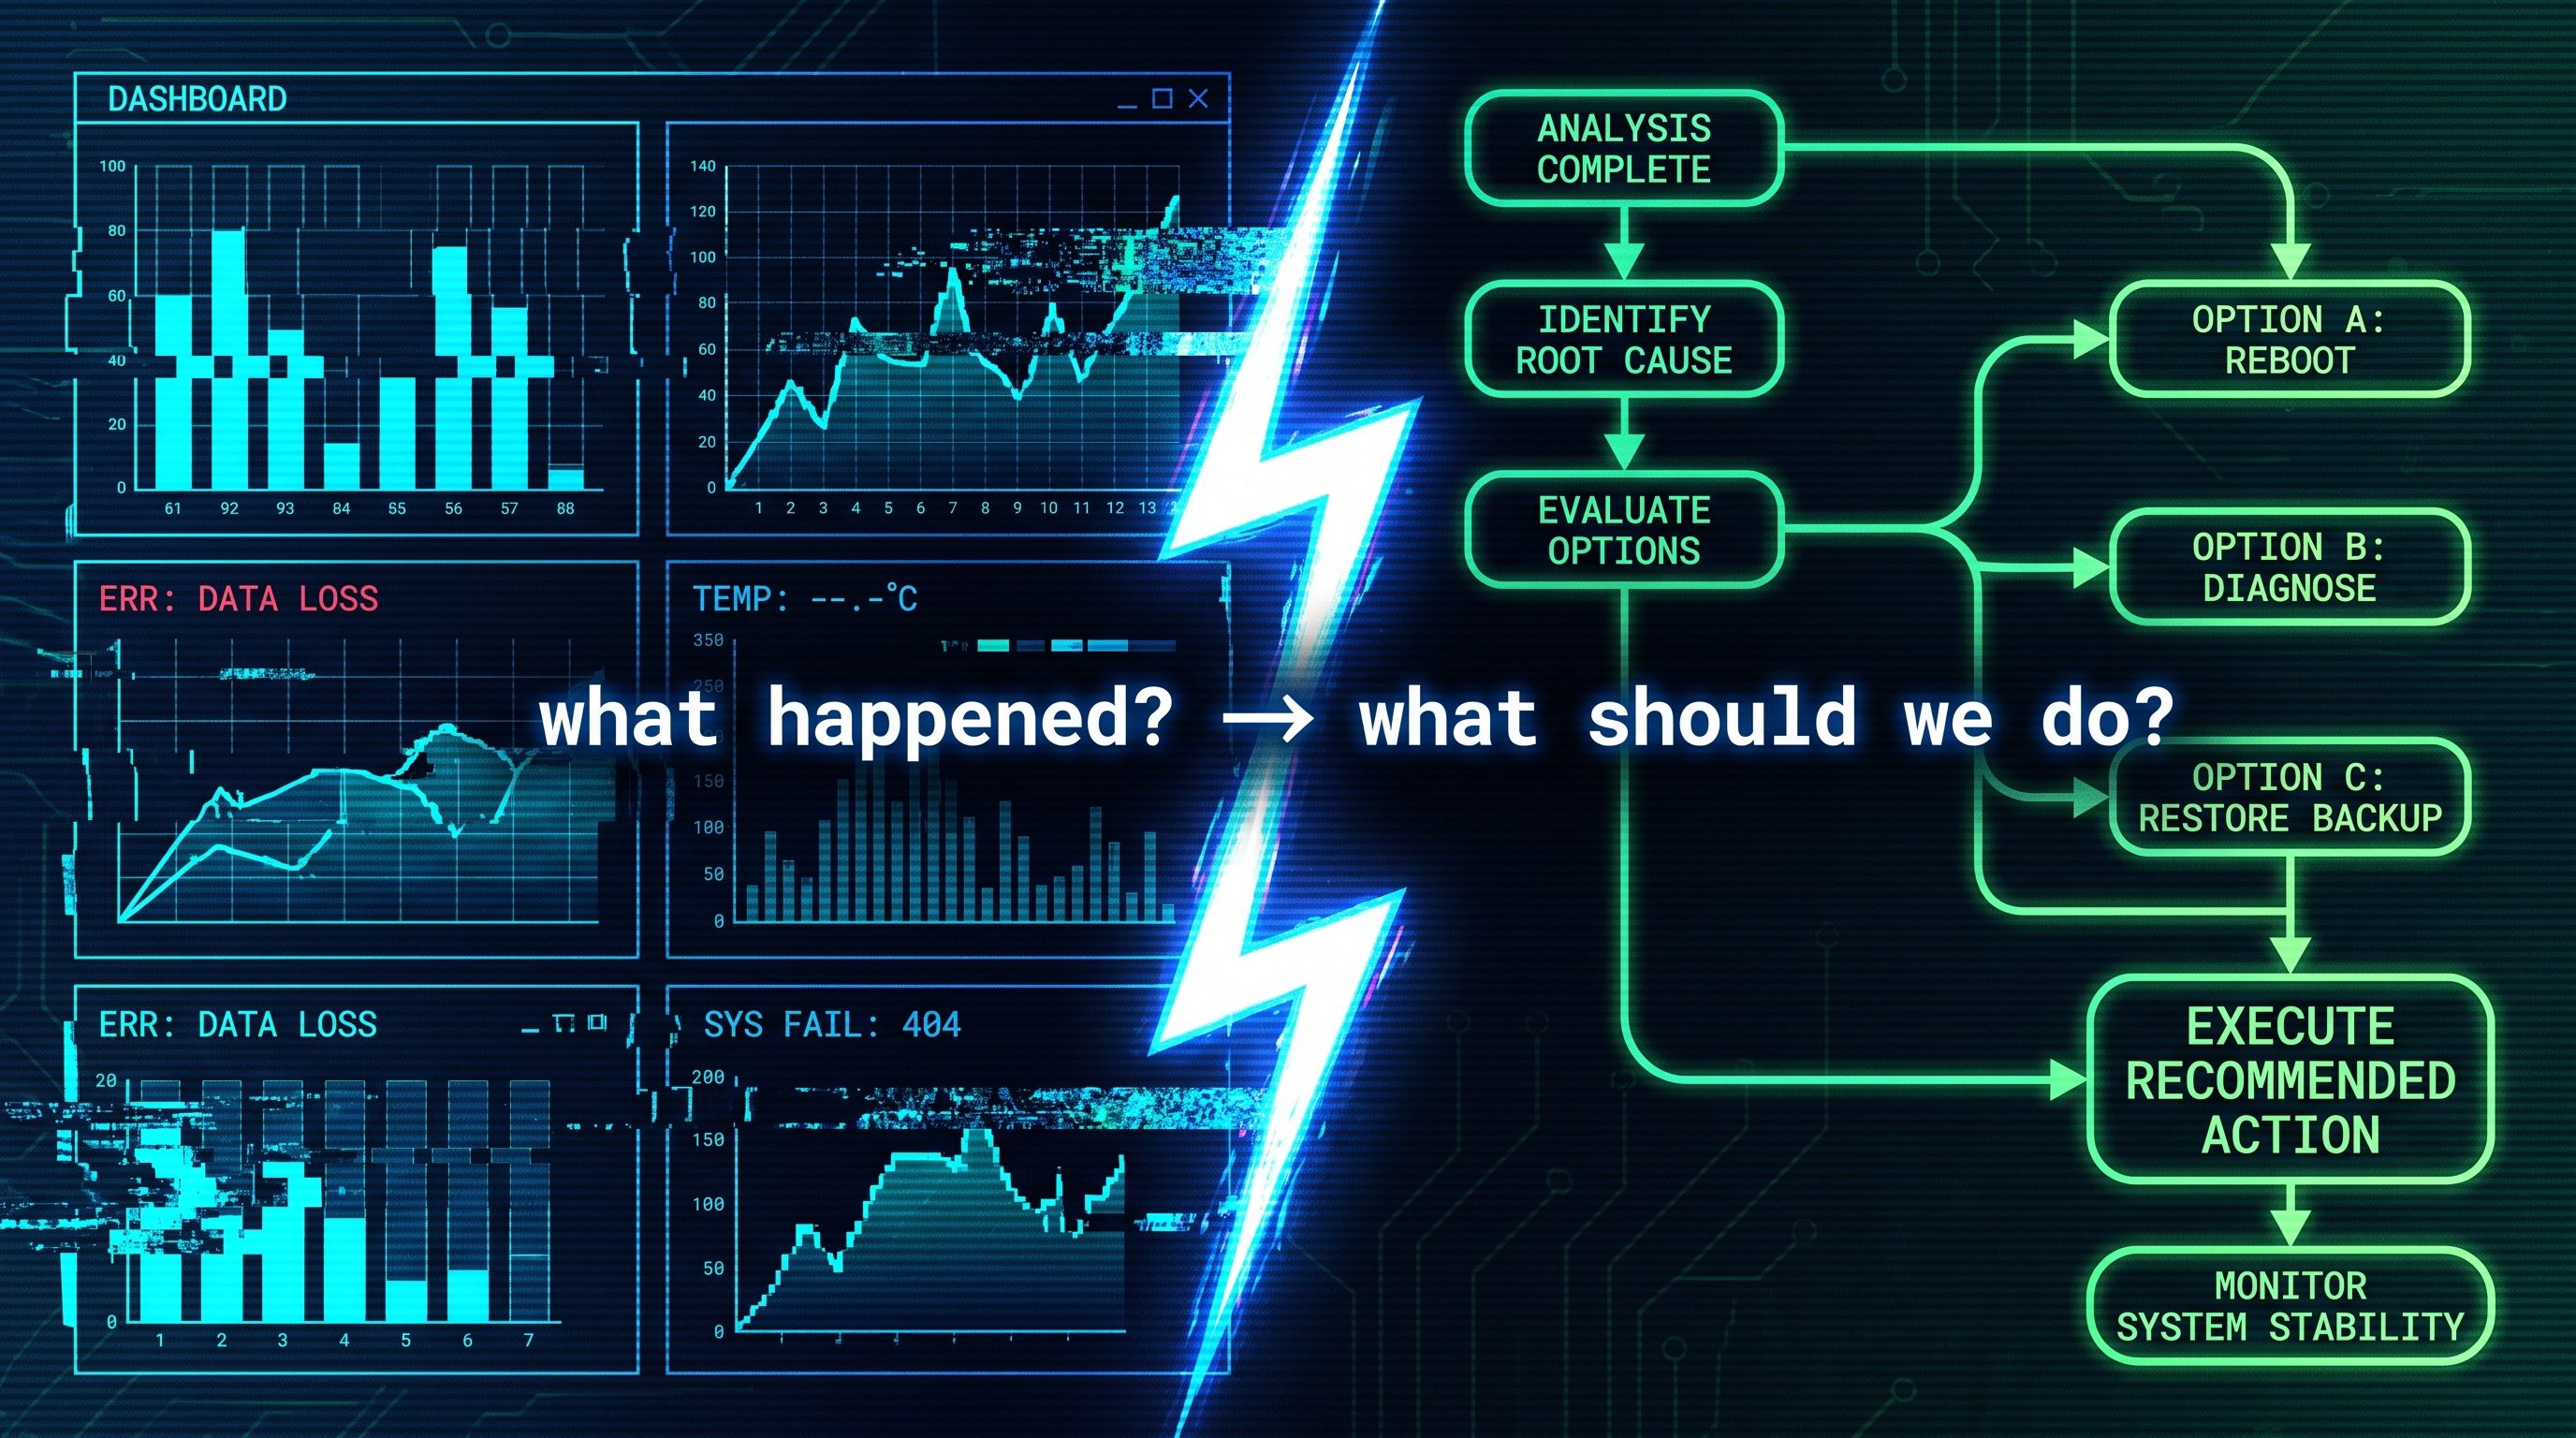
A dashboard answers the question "what happened?" Clearly, accurately, in a form that makes the past legible. It's a status object. The reader walks away knowing what is true about the business.
A good dashboard does this fast. Headline numbers up top, trends behind them, breakdowns one click away if you want them. The discipline is reducing the surface area of "what's true right now" to the smallest set of visuals that lets you say it confidently.
This is real, valuable work. Most reporting in most organisations is dashboard work. None of what follows is an argument against dashboards.
What a decision tool is for
A decision tool answers a different question: "what should we do?" Or, more precisely, "given what's true, what are the options, and which one is the right one to take?"
A decision tool isn't trying to tell you the state of the business. It assumes you already know the state, or that the state is one slicer away. What it's actually doing is laying out the consequences of choices. A pricing decision tool shows you what happens to revenue, churn, and gross margin under three different pricing scenarios. A staffing decision tool shows you the trade-off between adding a person now versus next quarter, with the resulting capacity profile.
The thing on the screen is structured around the decision, not the metric. You can usually tell within five seconds: a dashboard has KPIs; a decision tool has options.
Where the confusion lives
Most "dashboards" sold to executives are quietly being used as decision tools, and failing at the job, because they were built for the other one.
The pattern looks like this. Someone in the leadership team needs to make a call. They look at the dashboard they already have. The dashboard tells them what's happening but not what to do about it. They ask the data team to "add a few more visuals" or "filter by region." The dashboard grows. It now has fourteen visuals. The leader looks at it, can't see the decision, and asks for more filters.
The underlying problem is that no number of additional visuals or filters will turn a state-of-the-business dashboard into a decision tool. They're different artefacts. You can't bolt one onto the other; the orientation of the design is wrong.
I've watched dashboards drift in this direction for two or three quarters before someone names what's actually going on. The data team gets the blame for the dashboard "not being useful," which they take personally because the dashboard is correct and well-designed. It is. It's being asked to do a job it wasn't built for.
Why this is hard to see
The reason this distinction doesn't surface naturally is that "dashboard" became a generic word for "screen with numbers on it" sometime around 2015 and never recovered. Sales dashboards, marketing dashboards, "executive dashboards" - the word covers everything, so it stops meaning anything.
The result is that when a leader says "I need a dashboard," they're almost always saying "I need help making a decision." But the request gets translated, by everyone, into "build a screen with numbers on it." The decision-tool framing never enters the brief, because nobody used the words.
The way out of this is unglamorous: when someone asks for a dashboard, ask them what decision they're going to make from it. If the answer is "I want to know how the business is doing," you're building a dashboard, and the design follows the dashboard playbook. If the answer is "I'm trying to choose between option A and option B," you're building a decision tool, and the design has to follow a different playbook, one built around the choice, not the metrics.
What a decision tool actually looks like
Three things are usually present, and almost always missing from dashboards:
- A constrained choice. Decision tools don't show you everything; they show you the options on the table. If the question is "which of these three pricing tiers should we launch?" the screen has three columns. Not twelve filters.
- The consequences of each option. Not the current state, but the projected outcome under each option, with the assumptions visible. The reader can interrogate the assumptions and watch the outcomes change. This is what makes it a tool, not a picture.
- A clear default or recommended path. A decision tool has a point of view. It's not neutral. It might say "we recommend tier 2 based on the elasticity in the last three quarters" and let the reader argue with that. The argument is the point.
This is harder to build than a dashboard. It requires understanding the decision well enough to scope it, which means actually talking to whoever is making the call, in detail, before opening the design canvas. Most "dashboards that need to be more useful" are dashboards that skipped that conversation.
The clutter problem is also relevant here. The decision tool fixes the clutter problem by structural design, not by trimming.
The way to think about it
The shift is from "show the data" to "support the decision." Once you see it, you can't unsee which artefacts in your reporting are doing which job. Most of what gets called "reporting" is dashboard work, and that's fine. The places where the dashboard isn't landing - where leadership keeps asking for more, where the team is frustrated that the work isn't being used - are almost always the places where a decision tool was needed and a dashboard was delivered.
Once the categories are named, the work gets easier. You stop trying to make one artefact do both jobs. You build the dashboard cleanly. And when there's a decision to be made, you build the decision tool separately, structured around the choice, ruthless about what's on the screen.
Frequently Asked Questions
What is the difference between a dashboard and a decision tool?
A dashboard answers "what happened?" by showing the current state of the business through KPIs and trends. A decision tool answers "what should we do?" by laying out specific options, their projected consequences, and the assumptions behind each. Dashboards are state objects; decision tools are choice objects.
Why don't dashboards work well for decision-making?
Dashboards are designed to surface the state of the business, not the trade-offs between options. Adding more visuals or filters to a dashboard doesn't convert it into a decision tool - the underlying orientation of the design is wrong. Decisions need a different structure: options, consequences, and a default path.
How do I know if my stakeholder needs a dashboard or a decision tool?
Ask what decision they're going to make from it. If the answer is "I want to know how the business is doing," it's a dashboard. If the answer is "I'm choosing between A and B" or "I need to know whether to do X," it's a decision tool. The two artefacts require different designs and different scoping conversations.
Can a Power BI report be a decision tool?
Yes. Power BI is more than capable of being structured as a decision tool, especially with what-if parameters, scenario slicers, and side-by-side visuals showing different option outcomes. The platform isn't the constraint - the design brief is.
What's the most common mistake when building a decision tool?
Trying to make the same screen serve both jobs. Decision tools that also try to be dashboards end up cluttered with current-state visuals that distract from the choice on the table. Build them as separate artefacts and link between them.
