
Format painter: copy a Power BI visual's formatting in one click
Power BI's format painter copies fonts, colours and borders across visuals in one click, except for one axis setting that quietly breaks chart comparisons.
Tutorials, tips, and deep dives on Efficiency — every post from bianca.codes tagged Efficiency.
Power BI's format painter copies fonts, colours and borders across visuals in one click, except for one axis setting that quietly breaks chart comparisons.
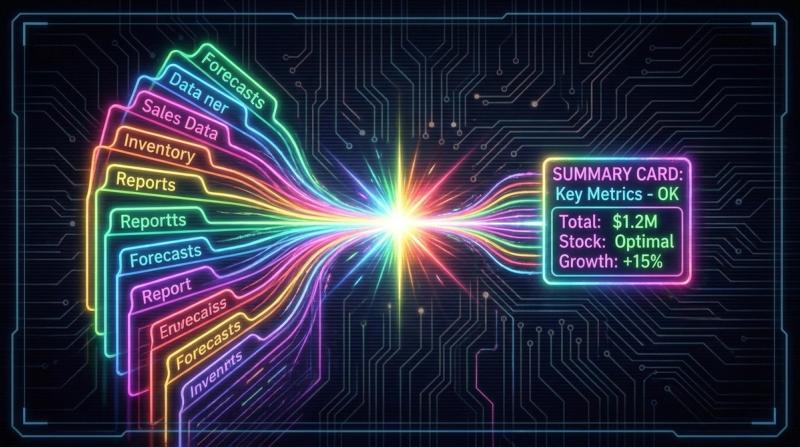
The one Copilot prompt that turns twenty unlabelled tabs into a sheet-by-sheet summary, outliers included, in under a minute.

One win: stop nudging boxes with the arrow keys. Select, Align, done - PowerPoint's Arrange menu lines up and evenly spaces any set of objects in two clicks.
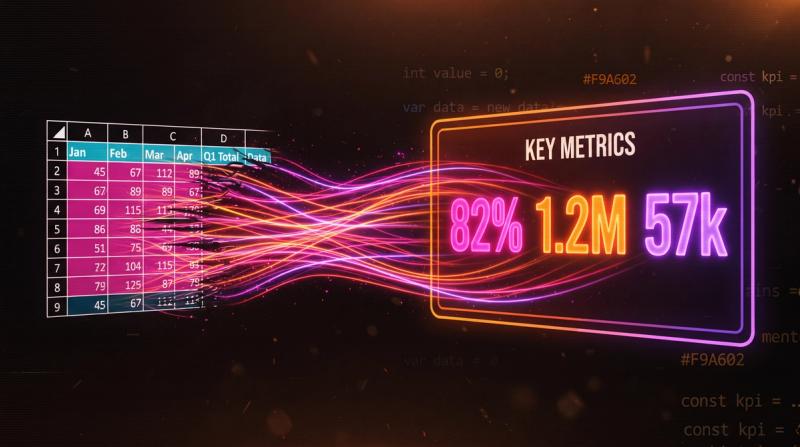
Paste Link turns three Excel cells into a PowerPoint object that updates itself, once you stop letting the linked range look like a spreadsheet.

Stop typing dollar signs by hand - one keystroke cycles through every Excel cell reference mode instantly.

The automation that saves your team four hours a week - and the manager who has no idea it exists. Why reliable work disappears, and two things that actually fix it.

Python in Excel can't write a file, but it can turn a transaction table into a chart that lives in the workbook and never goes stale - in one =PY() cell.

Learn SQL, build a portfolio, contribute to open source. The canonical data career advice is optimised for getting your first job, and useless immediately after.

The title changes, the salary changes, and the list of skills that matter changes completely. Worse, the things that made you good as an analyst quietly start working against you at the senior level.

In a small team, you're the analyst, the engineer, the dashboard designer, and the person who explains what a p-value is at the all-hands.
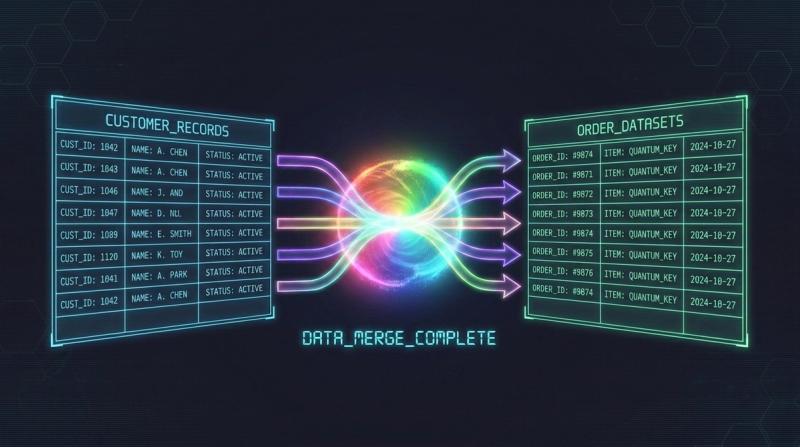
The Keep Rows filter in the Power Query UI handles 80% of row filtering tasks without you ever opening the Advanced Editor. Most people skip past it and go straight to writing M. Five clicks and you're done, and the M it generates is clean enough to modify later.

The analysts who get traction aren't the fastest at pulling data, they're the best at unpacking what was actually being asked. The skill is asking good questions, and nobody trains for it.

Automation bias is real: if you can automate something, it feels like you should. But some processes contain judgement calls that automation silently gets wrong, edge cases that require human revie…

Your flow runs daily — but you only need it Monday through Friday. One condition block and a formatDateTime expression, and your automation skips Saturday and Sunday without you touching it. Three …

You can't build every dashboard that gets requested. But 'no' lands differently depending on how you say it — and most data people either say yes to everything and resent it, or say no in ways that…

Slow reports get blamed on complex measures. Complex measures get rewritten. And the report is still slow — because the actual problem is a flat table with 47 columns, many-to-many relationships, a…

You'll build a summary that calculates a custom metric for every row in your dataset without a pivot table, without helper columns, and without copying formulas down. BYROW plus a LAMBDA gives you …

The more competent you get, the less people see the effort behind what you deliver. A clean dashboard looks effortless. A fast turnaround looks like it was always fast.

Helper columns aren't wrong. But when a running total requires three of them and breaks every time someone inserts a row, you've created fragility in exchange for familiarity. The Excel array funct…

Running totals used to mean helper columns or array gymnastics. SCAN changes that — it applies a function cumulatively across an array and hands you back every intermediate result. Once you see it …

SCAN hands you every intermediate result as it accumulates — which means a running total is one formula that spills down the column. No helper rows, no dragging, no breaking when someone inserts a …

They ask for a pie chart when they need a bar chart. They ask for a table when they need a trend line. This isn't ignorance — it's that they're translating a question into a visual type without kno…

The counter-argument to 'if your formula needs a scrollbar to read, it's wrong.' With LAMBDA, complexity lives in one named place and gets called cleanly everywhere else. The formula in your cell c…

You'll build a named LAMBDA called OVERDUE that takes a date and a threshold and returns a clean status label. Then you'll call it in three different tables in the same workbook. By the end, you'll…

Before LAMBDA, every Excel function that existed was one Microsoft decided to write. After LAMBDA, you can write them yourself — naming the logic, hiding the complexity, and calling your custom fun…
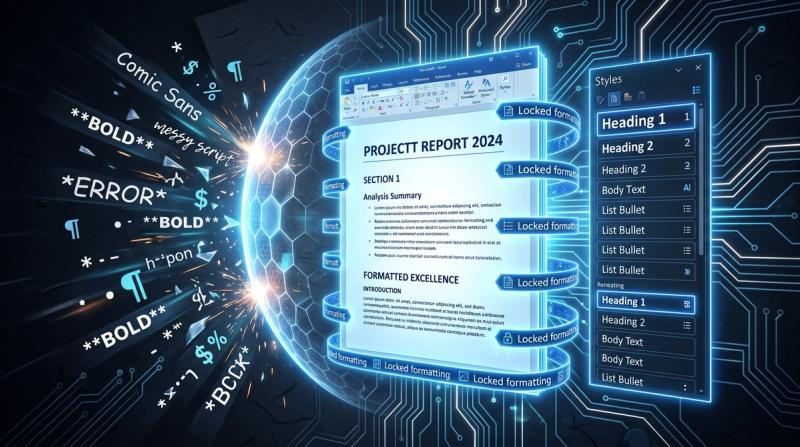
Your Word templates shouldn't fight you on formatting.
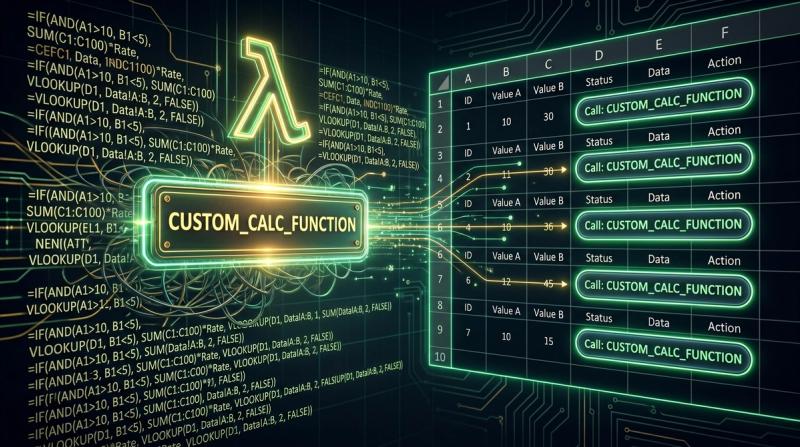
One function definition in the Name Manager, and every cell in the workbook can call it like a built-in. LAMBDA + named functions means you stop copy-pasting logic and start writing like someone wh…

You delivered a clean model, a solid dashboard, a real solution — and got a blank look in the room. The work was right. But explaining technical work to someone who doesn't share your frame of refe…

Power Query is a brilliant transformation tool. Most of the M code in production is doing things that belong in DAX, SQL, or Python - and the models are slow and the code is unmaintainable.
You'll build a reusable Power Query that finds the most recent entry per group - the kind of query that normally tempts people into messy MAXIFS workarounds in Excel. We're doing it properly, wit…

Table.Group in Power Query returns a table of tables, unlocking complex multi-level analysis you can't get anywhere else.

Five minutes to set up a SharePoint file-change trigger with a Teams notification. You'll never manually check whether that report got updated again.

Stop cringing. There's a way to talk about your accomplishments in Excel and Power BI that sounds competent, not arrogant. It's all about framing.

More charts don't mean more insight. Every visual you add is a question your stakeholder has to answer before they understand the point - and most reports ask them to answer fifteen questions bef…

You'll build a clean single-page report: KPI cards, a trend line, and one slicer. The kind that gets opened voluntarily, not just emailed as a screenshot. Starting from a blank canvas, ending with …

Complex formulas aren't the problem. Unreadable ones are. Before LET, you had to repeat the same range reference six times or accept that your formula was a black box. LET gives you named variables in

The advice is everywhere: if you're serious about data, you need SQL. But for most analysts already working in Excel and Power BI, the gap isn't SQL knowledge - it's data modelling instinct. Here…

One tweak to your most-used formula and it suddenly reads like plain English. LET() lets you name the messy middle parts — so next month's you won't need to reverse-engineer what current you was …

You deliver good work consistently, your manager knows you're reliable — and yet somehow you're invisible at promotion time. The problem isn't your output. It's that you've never made your work l…

It works, so why change it? Because every workaround you've added to compensate for VLOOKUP's limits is technical debt in your spreadsheet - and it compounds. The cost isn't visible until somethi…

Stop replacing VLOOKUPs. Your workbook deserves XLOOKUP without touching the formula.

I spent years writing 400-character Ctrl+Shift+Enter arrays just to filter a table, but the calculation engine finally changed the rules and killed that misery for good.