
What's Left of Copilot After the Excel Pane Disappears
The pane closing was a surface change, not a licence change. Here is the tested map of what an unlicensed account can still do, and what it never could.
Tutorials, tips, and deep dives on Microsoft 365 Apps — every post from bianca.codes tagged Microsoft 365 Apps.
The pane closing was a surface change, not a licence change. Here is the tested map of what an unlicensed account can still do, and what it never could.

On 15 April 2026 the Copilot button vanished from Excel with no in-app notice. This is the dated six-row audit of which surfaces still answer you, which refuse, and which never could.

Seven days actually driving Copilot across Excel, Word and PowerPoint - the wins, the confidently wrong deck, and the habit that mattered more than any prompt.

One clean Excel table and a Word template are all it takes for forty personalised reports, once the wizard is driven properly.
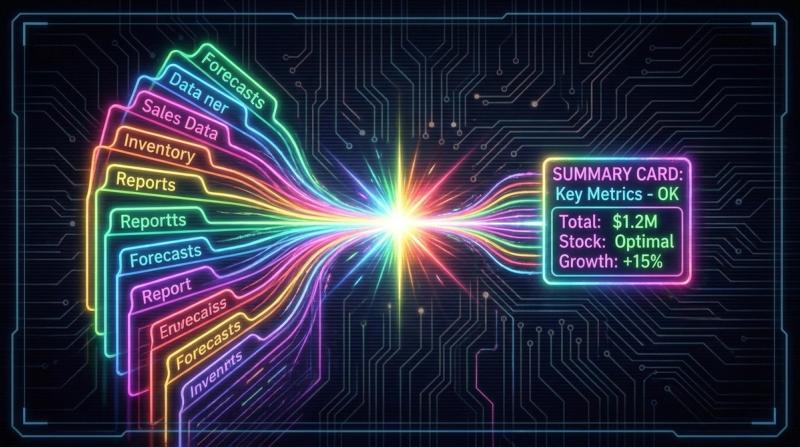
The one Copilot prompt that turns twenty unlabelled tabs into a sheet-by-sheet summary, outliers included, in under a minute.

Two tabs open, four spare hours a week, and everyone insisting the other tab is a waste of your time - here's the no-hype version of the beginner's fork.

Most Copilot opinions come from people who've never clicked into it. Open the thing for an afternoon and form one that's actually yours.
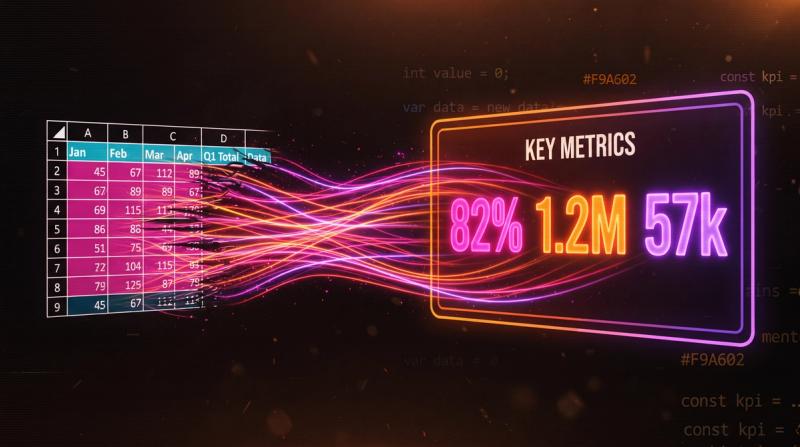
Paste Link turns three Excel cells into a PowerPoint object that updates itself, once you stop letting the linked range look like a spreadsheet.
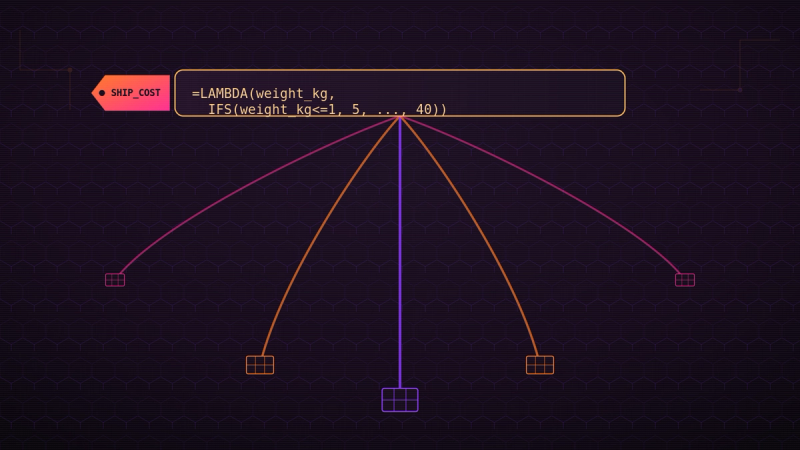
Copy-pasting the same formula across a workbook used to be the only way to reuse logic - until LAMBDA let you name it and call it like any other Excel function.

Most people learn Power Query by clicking through wizards. Nobody explains what it's actually doing - and that gap is why queries break in confusing ways.

For forty years an Excel cell could hold one of four things, and Python in Excel quietly added a fifth: a whole pandas DataFrame, living inside a single cell.
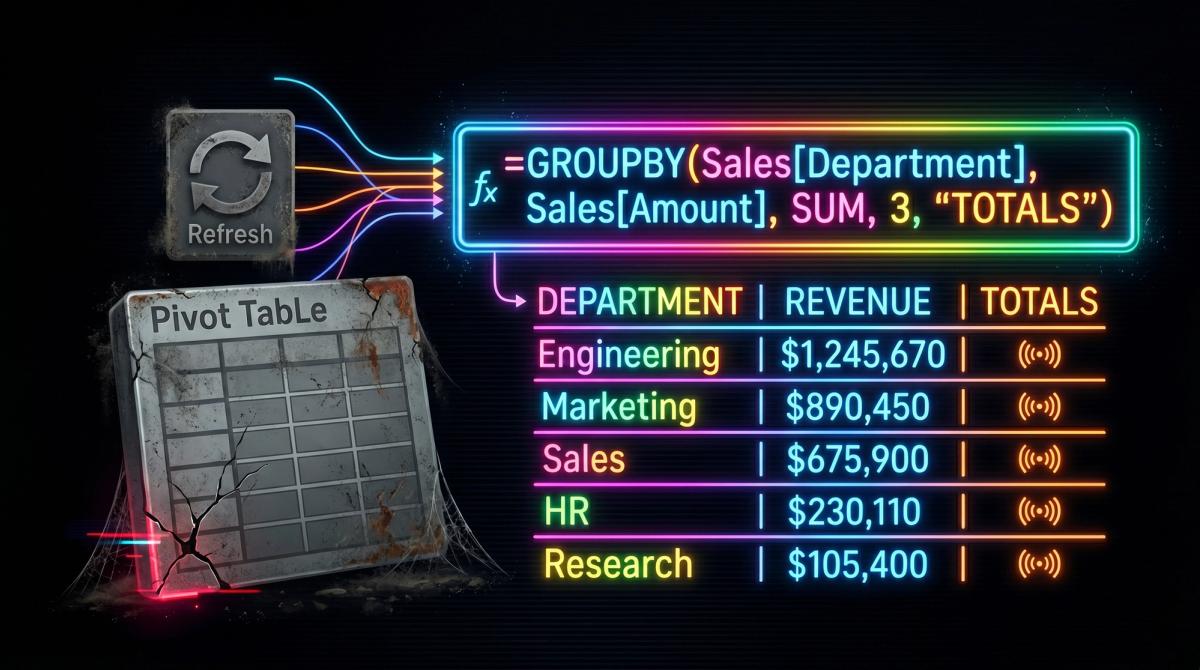
Pivot tables aren't obsolete, but reaching for one by reflex on every new analysis is a quiet tax GROUPBY does not charge.

A raw transaction table becomes a monthly sales summary by category with one GROUPBY formula - no PivotTable, no Refresh, and it updates the moment you add a row.
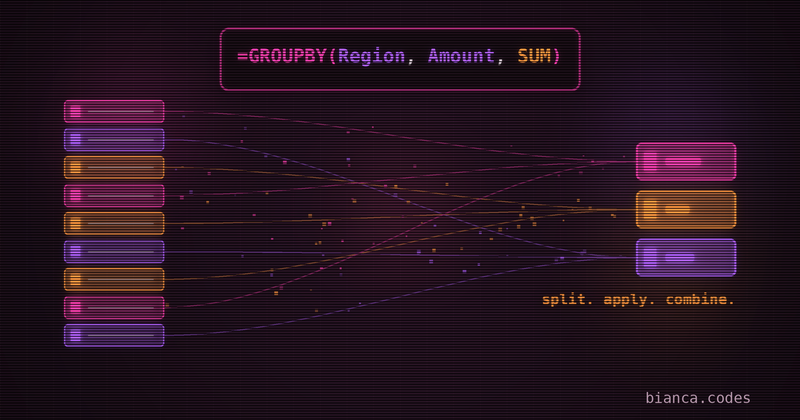
A pivot table is a tool you operate. GROUPBY is the same group-and-aggregate logic as a single spilled formula - the summary recalculates itself, with no fields to drag and nothing to refresh.
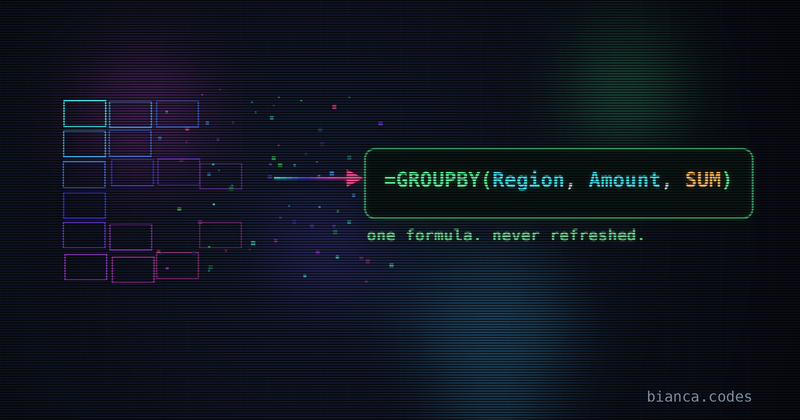
A pivot table is a snapshot that needs refreshing. GROUPBY is a formula that recalculates itself. Swapping one for the other takes about 90 seconds and removes a recurring chore.

Joining a column of names or tags into one comma-separated string used to need TEXTJOIN or a helper column. REDUCE does it in one formula, and lets you transform each item before it gets concatenated.

You'll build a dropdown list that reads from a structured table and includes every new row automatically. No named range maintenance, no 'why isn't my new entry showing up' moments.

MAP takes your LAMBDA and runs it on every element in an array. No helper columns, no dragging formulas, no VBA loops.

The analysts who get traction aren't the fastest at pulling data, they're the best at unpacking what was actually being asked. The skill is asking good questions, and nobody trains for it.

You can't build every dashboard that gets requested. But 'no' lands differently depending on how you say it — and most data people either say yes to everything and resent it, or say no in ways that…

XLOOKUP, LET, LAMBDA, BYROW, SCAN, MAP — Microsoft shipped more genuinely useful functions in the last three years than in the previous decade. If you learned Excel before 2022 and haven't revisite…

The more competent you get, the less people see the effort behind what you deliver. A clean dashboard looks effortless. A fast turnaround looks like it was always fast.

Helper columns aren't wrong. But when a running total requires three of them and breaks every time someone inserts a row, you've created fragility in exchange for familiarity. The Excel array funct…
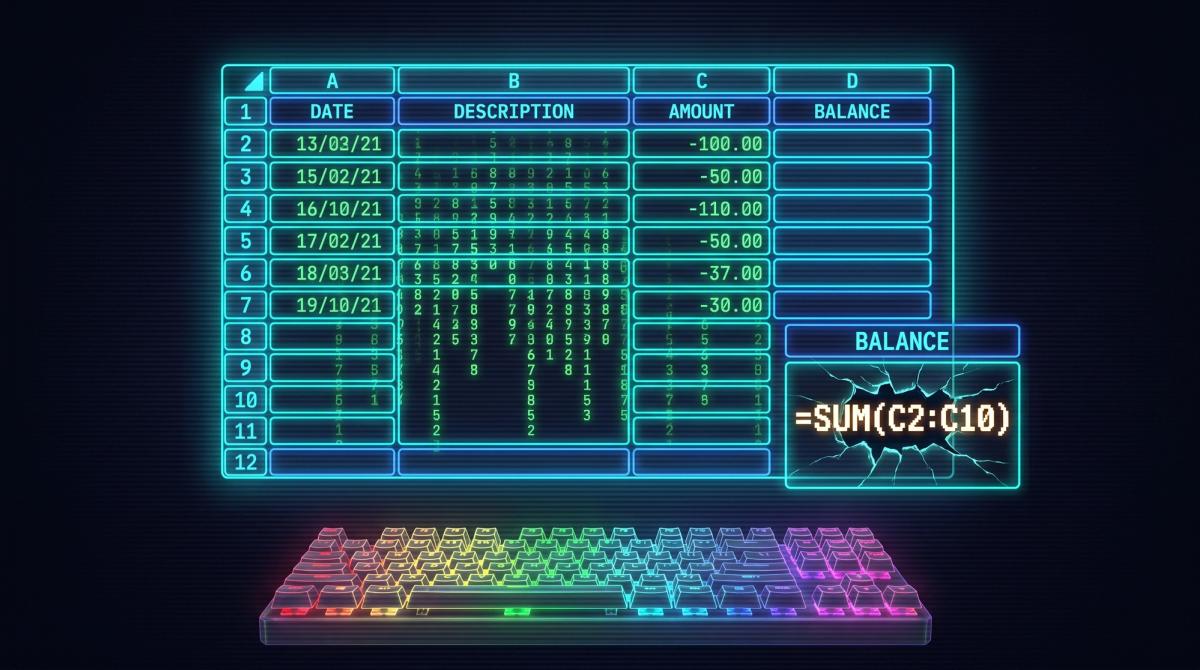
You'll build a balance tracker using SCAN and a structured table that extends itself as new rows come in. No helper columns, no fragile cell references, no 'just re-paste the formula down.' Add a r…

Running totals used to mean helper columns or array gymnastics. SCAN changes that — it applies a function cumulatively across an array and hands you back every intermediate result. Once you see it …
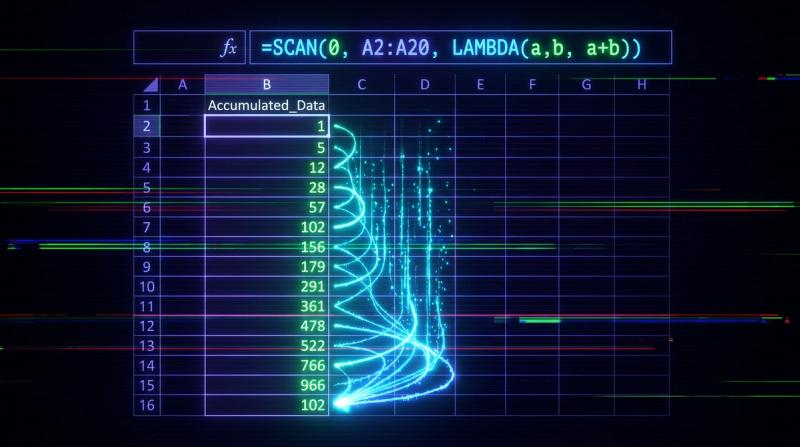
SCAN hands you every intermediate result as it accumulates — which means a running total is one formula that spills down the column. No helper rows, no dragging, no breaking when someone inserts a …

Before LAMBDA, every Excel function that existed was one Microsoft decided to write. After LAMBDA, you can write them yourself — naming the logic, hiding the complexity, and calling your custom fun…
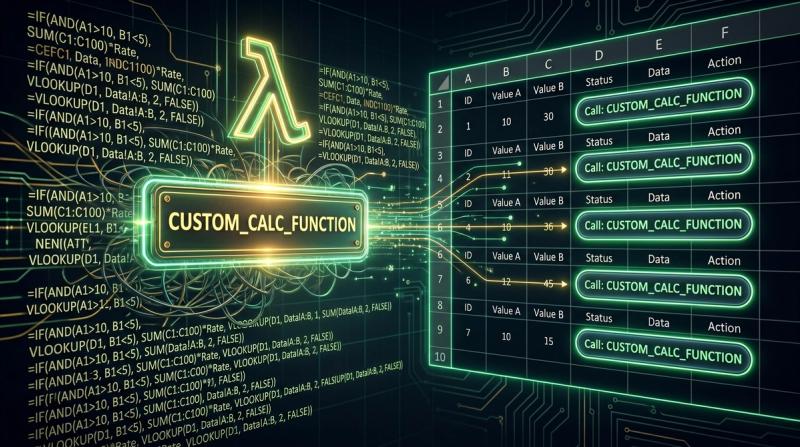
One function definition in the Name Manager, and every cell in the workbook can call it like a built-in. LAMBDA + named functions means you stop copy-pasting logic and start writing like someone wh…

You delivered a clean model, a solid dashboard, a real solution — and got a blank look in the room. The work was right. But explaining technical work to someone who doesn't share your frame of refe…

Complex formulas aren't the problem. Unreadable ones are. Before LET, you had to repeat the same range reference six times or accept that your formula was a black box. LET gives you named variables in

The advice is everywhere: if you're serious about data, you need SQL. But for most analysts already working in Excel and Power BI, the gap isn't SQL knowledge - it's data modelling instinct. Here…

You deliver good work consistently, your manager knows you're reliable — and yet somehow you're invisible at promotion time. The problem isn't your output. It's that you've never made your work l…

Stop replacing VLOOKUPs. Your workbook deserves XLOOKUP without touching the formula.

I spent years writing 400-character Ctrl+Shift+Enter arrays just to filter a table, but the calculation engine finally changed the rules and killed that misery for good.